
Unveiling the Secrets of Orange County's Housing Market: A Data-Driven Analysis
Explore the foundations of housing data in one of California’s most competitive real estate markets. In this post, we’ll walk through the process of gathering and organizing essential details from Orange County listings. This groundwork will set the stage for a deeper dive in the next post, where we’ll analyze these factors and uncover what drives affordability in the area.
Growing up in the sunny neighborhoods of Orange County, California, I always imagined moving back someday—if I could find something in this wild housing market! With homes that range from cozy to luxurious (and price tags that match), navigating the OC real estate scene can feel like a game. In this project, I dive into the data to decode the trends behind these sky-high prices, exploring everything from square footage to location. Whether you’re a hopeful buyer like me or an investor with an eye on the prize, let’s uncover what makes Orange County’s market tick.
Motivating Question
The primary question guiding this project is:
What are the key factors that influence housing prices in Orange County?
Ethical Considerations and Scraping Best Practices
Before diving into data collection, it’s essential to consider ethical guidelines and best practices for web scraping:
- Respect Website Policies: Always check the website’s
robots.txtfile to ensure that scraping is allowed. - Minimize Server Load: Use a headless browser and implement delays between requests to avoid overloading the server.
- Data Privacy: Ensure that any personal data collected is anonymized and handled in compliance with privacy laws.
How to Get Started: Step-by-Step Guide
If you want to embark on a similar data project, follow these steps:

1: Choose a Target Website:
- Ensure it provides publicly accessible data and that its
robots.txtfile doesn’t prohibit scraping. - I found my Orange County housing data from Houzeo
2: Set Up Your Environment:
- Install Selenium and a web driver like ChromeDriver.
- Use a headless browser to reduce server load.
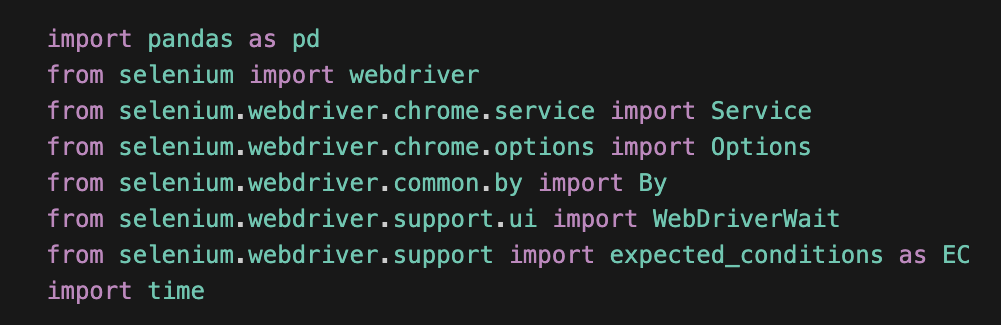
- Import the necessary libraries.
3: Write the Scraping Code:
- Identify the relevant HTML elements (e.g., price, address, city, beds, bath, square feet) using browser developer tools.
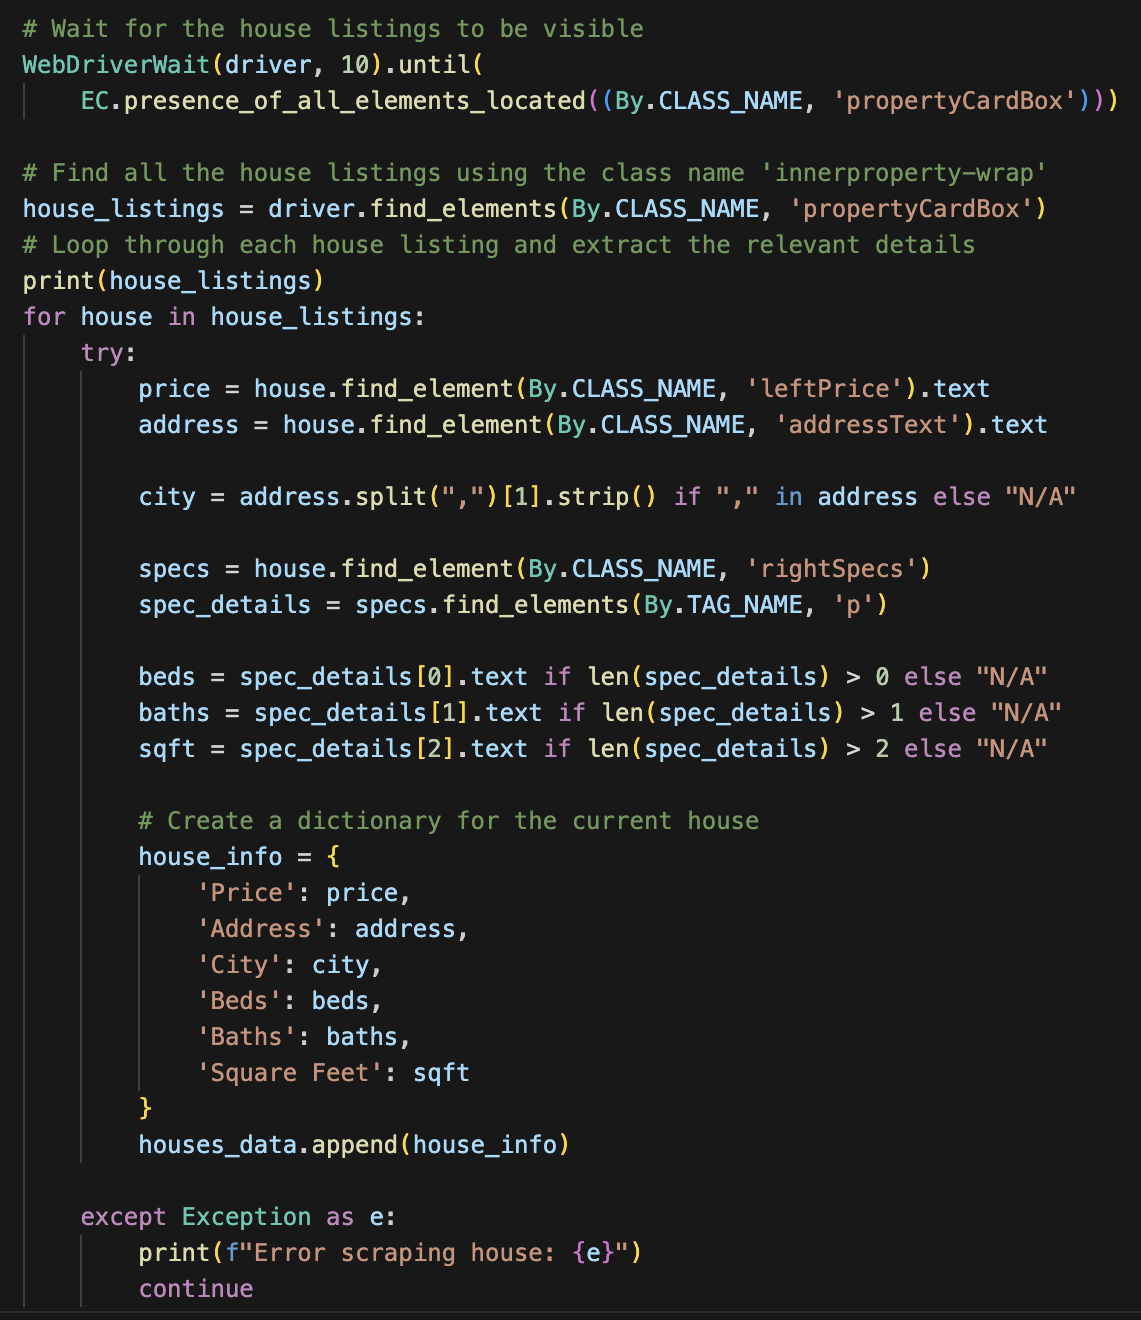
- Scrape each of the House Cards from the website
- From there, go through and extract price, address, city, beds, bath, and square feet by using the inspect page to find the relevant class names and scrape accordingly.
- Append all of the housing info to an empty list called houses_data which we will convert into a dataframe and clean in later steps!
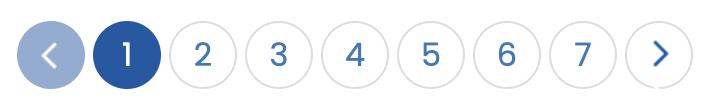
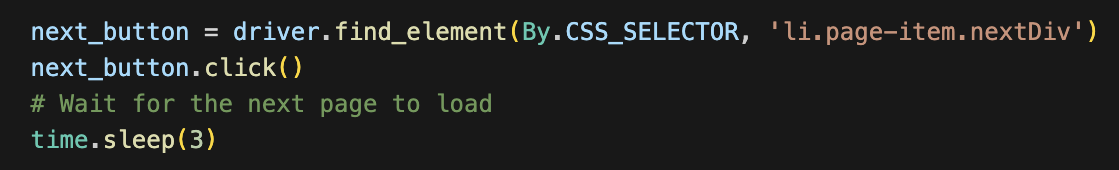
- Implement pagination to navigate through all pages of listings.
- This code finds the next button through the inspect page and “clicks” that button over and over again until it has scraped all of the pages.
- time.sleep(3) ensures that the page has enough time to load after every click
4: Clean the Data:
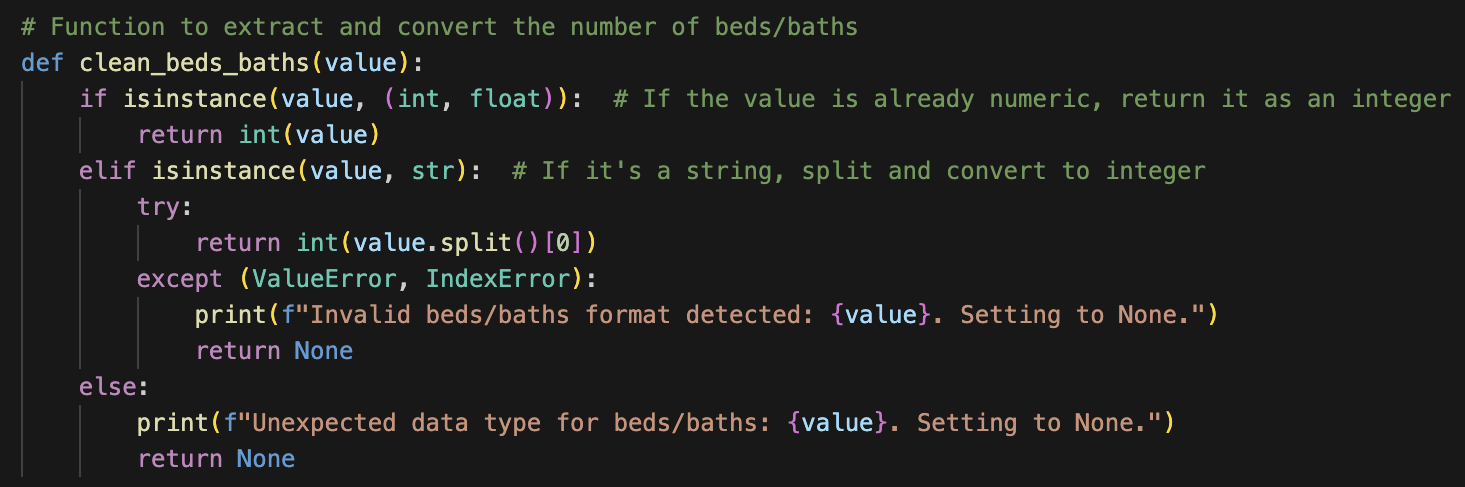
- Remove any unwanted symbols (e.g., dollar signs) and convert text values (e.g., “5 Bds”) to integers.
- For Example:
- When web scraped, the number of beds is saved in our dataframs as “5 Bds”. We need our bed number to be an integer so we can work with it in our later analysis of our data. To do this, I created a function that takes the “messy” output and cleans it by checking if it’s a string, and splitting the string up so we can remove the “Bds” section, and turn the remaining number into an integer! Easy peasy! (Code shown below)
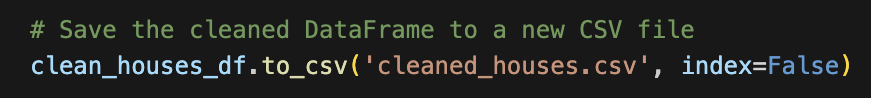
5: Store the Data:
- Save your cleaned dataset as a CSV file for further analysis.
- A link to my GitHub repository, with my complete code can be found at the bottom of this blog in the “Further Information and Resources” section.
Summary of the Dataset
The final dataset includes the following variables for each property:
- Price: The listing price of the house, converted to numeric format.
- Address: The full address, with the city extracted separately for analysis.
- City: The city within Orange County where the property is located.
- Beds: The number of bedrooms.
- Baths: The number of bathrooms.
- Square Feet: The total square footage of the property.
Below is the first row of the datasaet, to show what the data looks like:

Summary Statistics
The dataset includes 488 properties, with the following summary statistics for each key numeric variable:
- Price: Ranges from $1 up to $42,000,000, with a mean of approximately $1,988,457.
- Beds: Properties range from 1 to 13 bedrooms, with an average of 3.4.
- Baths: Properties have between 1 to 12 bathrooms, with an average of 2.8.
- Square Feet: Sizes range from 560 sqft to 26,707 sqft, with a median size of 1,705.5 sqft.
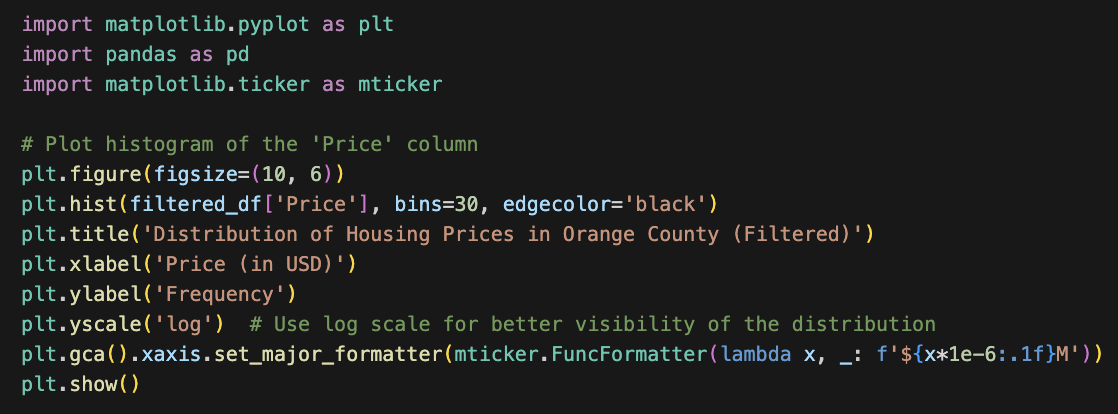
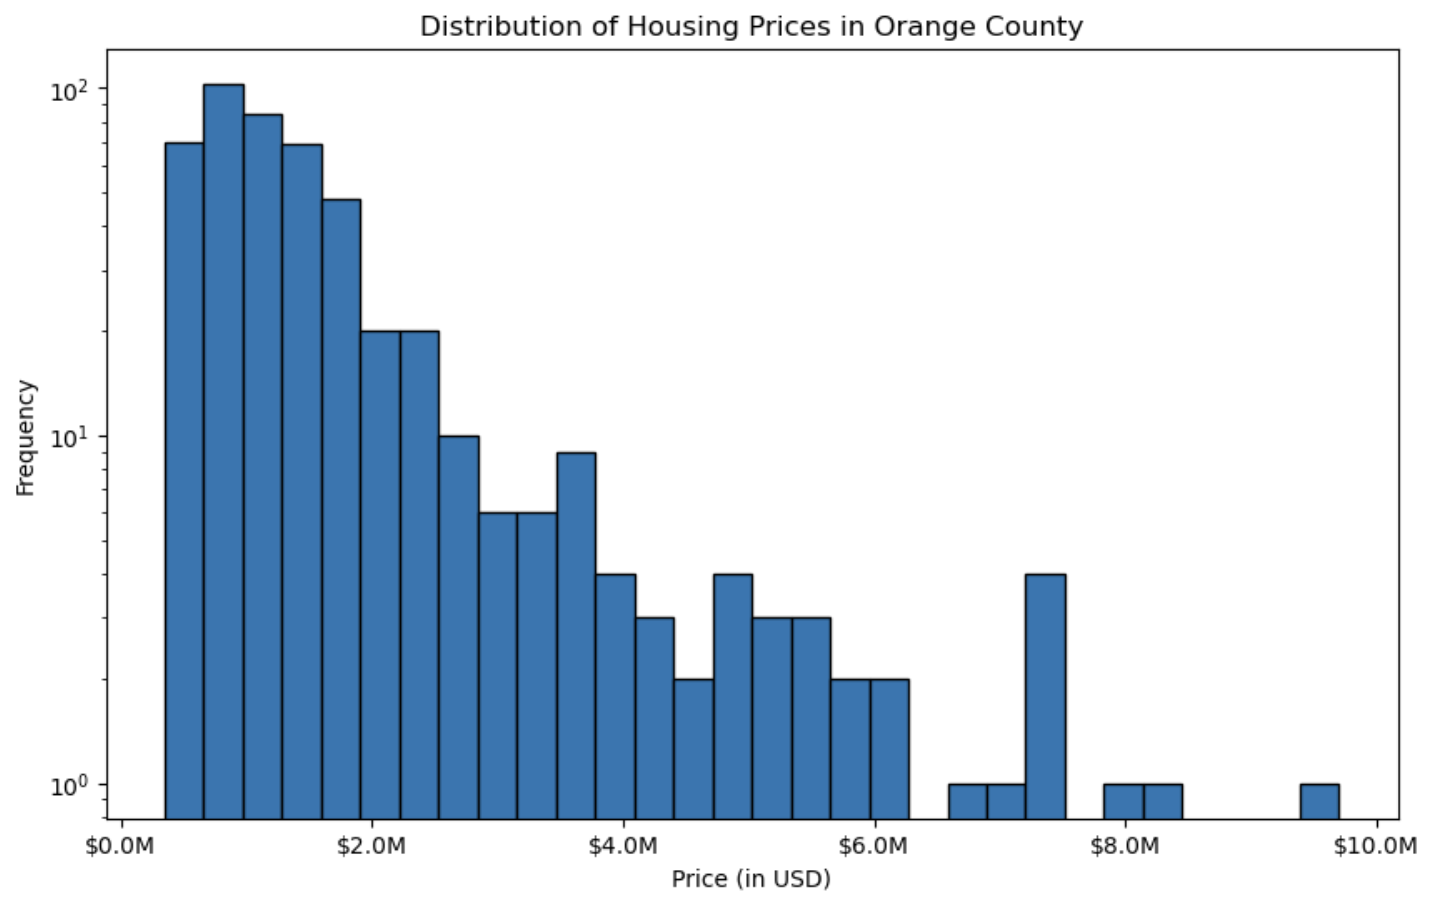
Price Summary Histogram
- Below is the code and output to display the distribution of housing prices to highlight price ranges and get a sense for how much you’ll be spending in the Orange County housing market.
Conclusions and Next Steps
 Source: flaticon.com
Are you curious to see how we can unlock hidden insights in the Orange County housing market? In my next blog post, I’ll dive headfirst into exploratory data analysis (EDA) to uncover key trends and insights that could guide your search for the perfect home. I’ll be tackling questions like:
- Which city in Orange County offers the most value for your budget?
- What matters more in determining price: spacious square footage or the number of bedrooms?
- And so much more!
Stay tuned as I break down the numbers, bust some myths, and give you a roadmap for navigating this challenging market. Don’t miss it – your dream home might just be a data insight away!
Further Information and Resources
- For a detailed guide on web scraping best practices, check out Web Scraping Best Practices.
- Learn more about real estate data analysis here.
- To see my code and look at my dataset, go to my Git Hub Repo
- Make sure to leave a comment on what you would like to see from me next!